Metrics for evaluating generative image models
This article introduces the two principal metrics used to evaluate generative image models: Inception Score and Fréchet inception distance.
Training generative image models can be hard, yet evaluating them properly can be harder still. The simplest metric is the judgment of human experts. It is, however, costly, slow and susceptible to bias. Human experts are influenced by how the task is set up, by their motivation and by the feedback they receive on their errors. No objective function existed that could be used to assess generated images. For that reason, alternative methods have been created to measure the quality, diversity and fidelity of generated images. The most widely used among them are Inception Score (IS) and Fréchet inception distance (FID).
Inception Score
The Inception Score was first introduced in the paper Improved Techniques for Training GANs 2016. It is designed to measure two things:
- Image fidelity. Every image must show a clearly recognizable object.
- Diversity. The model should be capable of generating many different object classes, ideally according to a uniform distribution. Every class should have the same likelihood.
The IS is calculated with the following function:
p(y|x) is a conditional label distribution. The paper’s authors use the Inception network to predict a label for every generated image. When the image shows a clear object, the inception model should assign a high probability to one of the classes, and the entropy will be low H(y|x)~0.
The second part of the equation, p(y), is the probability with which the inception model predicts each class. Ideally, all classes should be equally probable, so the entropy should be high H(y)~+∞.
KL stands for the Kullback–Leibler divergence. It measures how similar the two distributions are. A large value means they are not alike at all. This meets the requirement for both fidelity and diversity.
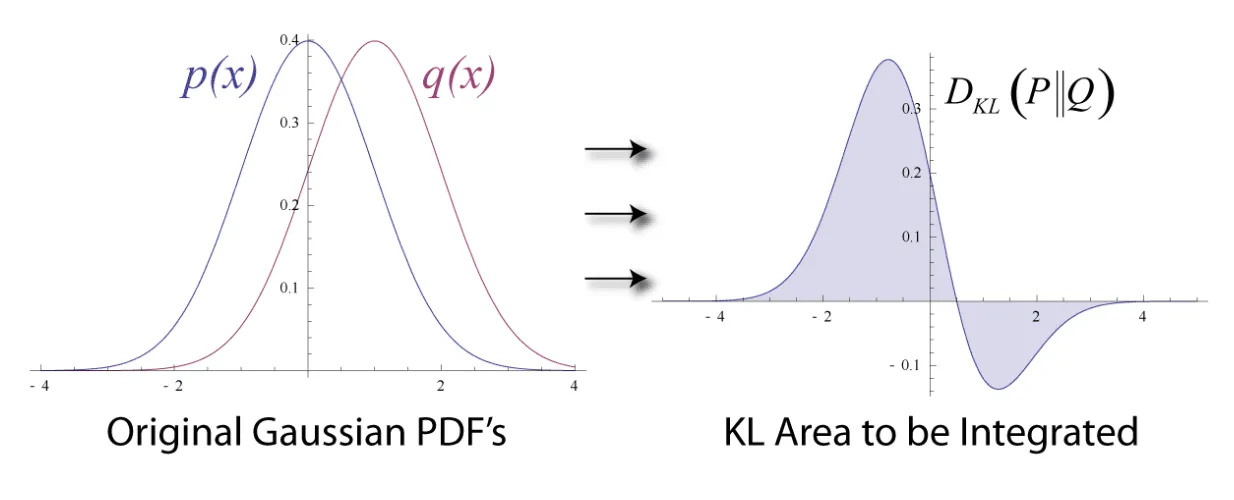
Figure 1. KL divergence measures how similar distributions are. DKL(P||Q) = ∑xP(x)ln(P(x)/Q(x)). DKL is not symmetric DKL(P||Q) != DKL(Q||P). Source
The exponential function was added purely for aesthetic reasons. A higher IS is better.
Weaknesses of the Inception Score
The Inception Score does, however, have certain weaknesses. They were described in the paper A Note on the Inception Score 2018. The most important ones are:
- Poor generalization ability – The IS doesn’t measure how diverse images are within a class. A GenAI model may generate identical images within a class and still get a high score. As a result, the model isn’t penalized for memorizing only a small part of the training data.
- Sensitivity to model weights. Even tiny differences in weight values can cause large variations in the evaluation results.
Depending on whether a Keras or a Torch implementation of the Inception Network is used, the mean Inception Score comes out 3.5% higher for ImageNet validation images and 11.5% higher for CIFAR validation images.
- Optimizing a GenAI model directly against the Inception Score teaches it to produce adversarial samples rather than better-quality images.
Figure 2. Adversarial samples produced by a diffusion model trained with an IS objective. The samples reached an Inception Score of 900.15, with the maximum IS score being 1000. Source
- The IS works best for GenAI models trained on the same dataset as the Inception classification model (the original Inception model was trained on ImageNet). Using IS for GenAI models trained on, say, CIFAR-10 may produce misleading results. The reason is that the top 10 classes predicted by the Inception model don’t match the classes in CIFAR-10. This mismatch between the Inception model’s classes and the classes of another dataset can lead to a wrong estimate of p(y), the marginal class distribution over the set of generated images X, and of p(y|x).
Fréchet inception distance
Figure 3. Visualization of how the FID score is computed. The FID is the distance between two normal distributions whose mean and sigma are calculated from the first and second momentum of the image features produced by the inception model.
Due to the weaknesses of the Inception Score, the Fréchet inception distance was put forward for evaluating GenAI models. It reflects how similar generated images are to real ones better than the Inception Score does. Like IS, FID relies on a pre-trained Inception-v3 model. Rather than the output probabilities, though, FID uses the last pooling layer (the one just before the output classification layer) as a coding layer. 50k images are passed through the inception model, and momentums are calculated on the vectors from the coding layer. More precisely, the first (mean) and the second (covariance matrix) momentum of this layer are computed. These statistics are obtained for a set of real images and a set of fake images. Lastly, the distance between the two distributions is computed with the Frechet distance.
Here mu_r and mu_f denote the mean of the real and fake features respectively, C_r and Cf denote the covariant matrix of the real and fake features respectively, Tr is the trace linear algebra operation, and || ||^2 is a sum squared difference. The smaller the distance (FID score), the better the image quality.
Figure 4. A lower FID score means better image quality and fidelity. Source
The paper Generating images with sparse representations introduced an improved variant of FID called sFID. Rather than the last pooling layer, it relies on intermediate spatial features of the inception network. sFID matches human judgment of good-quality images more closely. It correlates strongly with realistic textures and structures, and achieves diversity, much like human perception.
Although sFID is by far the best automatic metric for assessing GenAI image models, the IS is still commonly used alongside it. The reason is that the IS better reflects how faithful an image is to the requested condition.
Weaknesses of the FID score
A paper on the weaknesses of FID was published recently: [Rethinking FID: Towards a Better Evaluation Metric for Image Generation](https://arxiv.org/abs/2401.09603#:~:text=We highlight important drawbacks of,assumptions, and poor sample complexity.). Its authors find that FID has trouble reflecting gradual improvements in image quality and fails to capture image distortions. They point out the following problems, which need to be solved to improve the FID score:
- The inception model yields weak image embeddings. CLIP embeddings are trained on x400 more training samples, and rather than on classification tasks, CLIP is trained to match images with their descriptions accurately. Consequently, CLIP yields richer embeddings than the Inception model.
- FID assumes a normal distribution of special features, which may not always hold.
- The FID score is biased. An FID score calculated on a finite set of samples is not the true value of the score, and it depends on how many samples were used to compute it. The details are described in the paper Effectively Unbiased FID and Inception Score and where to find them.
- FID is sample inefficient. Reliably estimating the d × d covariance matrix for high-dimensional feature vectors requires a large sample.
To address these weaknesses, the paper’s authors suggest CLIP-Maximum Mean Discrepancy (CMMD).
CLIP-Maximum Mean Discrepancy
CMMD is an enhanced version of the FID score. It replaces the Inception embeddings with far richer CLIP embeddings, and the Fréchet distance with a Maximum Mean Discrepancy. MMD was created to check whether samples come from the same distribution. Unlike the FID score, MMD used with a characteristic kernel makes no assumptions about how the data is distributed. What’s more, it is an unbiased estimator and is sample efficient when dealing with high-dimensional data.
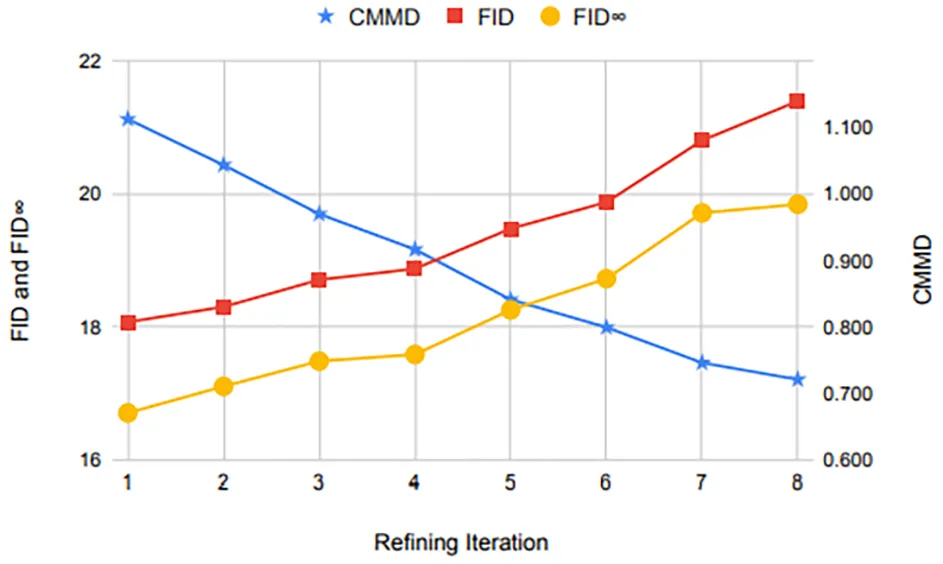
Figure 5. The authors of CMMD show that the FID score can fail to reflect a gradual improvement in image quality. The quality of the pantheon image improves step by step from left to right. Yet, as the bottom plot shows, the FID score rises monotonically. The newly proposed CMMD metric, by contrast, correctly reflects the gradual image improvement. Source
Summary
This article covered the two principal metrics for evaluating generative image models: Inception Score and Fréchet inception distance. The Inception Score does not reflect image diversity within a single class, and it should be used with an inception model trained on the same dataset as the generative model. FID, in turn, fixes the IS diversity problem, but it is less suited to evaluating fidelity to a condition and wrongly assumes that image features follow a normal distribution. The newly proposed CMMD score tackles the weaknesses of FID by using Maximum Mean Discrepancy, which makes no assumptions about the data distribution. It improves on FID further by using far richer CLIP embeddings in place of Inception embeddings.