When Project Loom meets Quarkus
Find out how Project Loom and Quarkus behave together and how to run a Quarkus application backed by Postgres on virtual threads. Load test results for this application are included as well!
Java 19 shipped Project Loom as a Preview feature.
Loom sets out with the following goal:
“(..) to drastically reduce the effort of writing, maintaining, and observing high-throughput concurrent applications that make the best use of available hardware”Ron Pressler, May 2020
It will be a while before Loom leaves Preview and becomes a full release. Since it can already be used, though, the Quarkus team chose to experiment with it in Version 2.10.0 Final. Their early work on virtual threads lets us try Loom on more involved examples.
In this post, we present Project Loom and Quarkus and explain how to run a Quarkus application with Postgres on top of virtual threads. We also share the results of load tests run against that application.
Why Project Loom
In Java, parallel and concurrent computations have traditionally been handled with threads.
At its core, Java threading relies on operating system threads. Every thread created in the VM is backed by its own system thread, which executes the Thread.run() method. As a consequence, running the threads is the job of the OS.
Whatever happens, every thread takes up memory and demands CPU time. When an OS multitasks on a multicore CPU, all threads have to fight for access to hardware resources. Using multitasking efficiently therefore requires solving a number of problems – thread locking, thread scheduling and synchronization among them.
Threads have been part of Java from day one. Over the years, they kept evolving and adjusting to what new hardware could offer. They started out as Green Threads, soon became platform threads by default, and were later extended by the Concurrency API added in Java 1.5. Since that time, Java threading – with Future, ExecutorService, ForkJoinPool, Concurrent_ maps and much more – has become mature.
Still, as time passes, the IT world keeps asking for more and more computing power. High throughput is the yardstick by which many software systems are judged. That requires using resources as efficiently as possible, in as little time as possible.
For any server that has to cope with a growing load, it comes down to a fine balance between how many threads compete for resources and how quickly the server responds.
A pool with few threads may get swamped by a long queue of requests. A pool with too many idle threads, on the other hand, ties up OS thread resources that other processes might need.
In his book “Java Concurrency in Practice”, Brian Goetz suggests the following formula for sizing a thread pool:
Number of threads = Number of CPUs * Target CPU utilization * (1 + Wait time / Compute time)This doesn’t eliminate the problem, though. It merely lets you measure instead of guessing.
Spawning new threads in the JVM is fairly costly. It involves setting up a java stack and a system stack, making system calls and callbacks. That is pricier than creating ‘standard’ objects, especially for a server that needs to serve many short-lived requests and would create a fresh thread for each one. In a development environment this is irrelevant, but in high-throughput production it is critical.
Why care about Loom
Project Loom tries to reduce or eliminate these problems with virtual threads.
The concept is a Java Thread that isn’t tied to a platform thread. Such a virtual thread doesn’t consume OS resources or CPU until it actually has to, so the platform thread remains available for other work. A long-running, CPU-heavy thread, however, will pin itself to the platform thread and become a bottleneck. That’s because virtual threads aren’t faster than regular threads – what they improve is how platform threads are utilized.
Virtual threads address high-throughput needs that regular threads can’t meet because of the limited number of CPU cores. Speeding up computation or achieving low latency is not what they were built for.
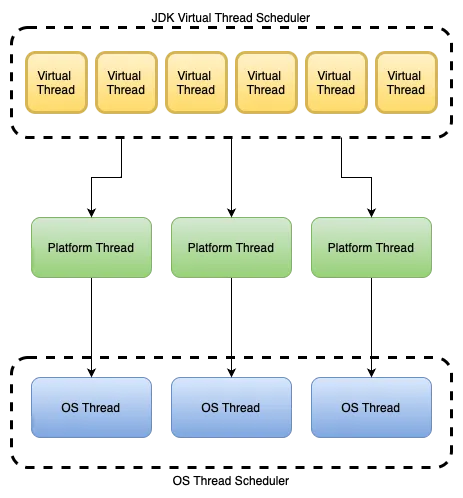
Platform threads in Java are scheduled by the operating system, while virtual threads are scheduled by the JDK. The JDK scheduler maps virtual threads onto platform threads in a many-to-many fashion, as shown in the picture below.
In the following sections, we show virtual threads at work by building a Quarkus application and load testing it under various configurations.
Quarkus and virtual threads
Quarkus is a Java stack built with cloud deployment as a primary goal. It advertises quick startup and a small memory footprint. It plays well with Kubernetes and lets applications run on both OpenJDK HotSpot and GraalVM. Quarkus offers imperative as well as reactive programming, the former being implemented natively with Netty and Mutiny.
Prerequisites
The sample application relies on the following tools, which you need to install before continuing:
- Java OpenJDK HotSpot 19
- Docker
- Quarkus
- siege - a utility for regression testing and benchmarking
Init sample application
Begin by initializing a Quarkus app
quarkus create app loom-quarkusDependencies
A few extra libraries have to be added to the Maven dependencies.
quarkus-agroal, quarkus-jdbc-postgresql, quarkus-reactive-pg-client are data source libraries that take care of blocking and nonblocking connections, respectively.
quarkus-resteasy-reactive-jackson makes it possible to build REST services that return JSON.
<dependency>
    <groupId>io.quarkus</groupId>
    <artifactId>quarkus-agroal</artifactId>
</dependency>
<dependency>
<groupId>io.quarkus</groupId>
<artifactId>quarkus-reactive-pg-client</artifactId>
</dependency>
<dependency>
<groupId>io.quarkus</groupId>
<artifactId>quarkus-jdbc-postgresql</artifactId>
</dependency>
<dependency>
<groupId>io.quarkus</groupId>
<artifactId>quarkus-resteasy-reactive-jackson</artifactId>
</dependency>Enable virtual threads
The virtual threads shipped with Java19 are switched off by default, so Java has to be told explicitly to turn them on. You can do that with the –enable-preview parameter in the Maven configuration file. Set the release version to 19 as well.
<plugin>
    <artifactId>maven-compiler-plugin</artifactId>
    <version>${compiler-plugin.version}</version>
    <configuration>
        <compilerArgs>
            <arg>--enable-preview</arg>
        </compilerArgs>
        <release>19</release>
    </configuration>
</plugin>
Data source configuration
Quarkus provides Dev Services, which make development easier. Among other things, they can automatically provision and configure a Postgresql database. In that case Quarkus handles the data source configuration for both blocking and nonblocking access, which is perfectly sufficient for this sample application.
Turn on the database dev services in application.properties:
quarkus.datasource.devservices.enabled=trueREST Service
This service demonstrates how virtual threads are used. Quarkus runs services reactively by default, so the service needs a fine-grained configuration based on the @Blocking, @NonBlocking, and @UseVirtualThreads annotations.
@Path("/sandbox")
@Produces(MediaType.APPLICATION_JSON)
@NoCache()
@Blocking
public class LoomSandboxResource {

    BlogpostsRepository repository;

    @Inject
    public LoomSandboxResource(BlogpostsRepository repository) {
        this.repository = repository;
    }

    @GET
    @Path("/blocking/jdbc")
    public List<Blogpost> blogPostsBlockingJDBC() {
        return repository.findAllJdbc();
    }

    @GET
    @RunOnVirtualThread
    @Path("/loom/jdbc")
    public List<Blogpost> blogPostsLoomJdbc() {
        return repository.findAllJdbc();
    }
}
Data repository
The application uses just one repository. That repository, however, works with both the blocking AgroalDataSource and the non-blocking PgPool data sources.
@ApplicationScoped
public class BlogpostsRepository {
    final PgPool client; //This is nonblocking postgres driver
    final AgroalDataSource agroalDataSource; //This is standard blocking postgres driver
    private final String SELECT_ALL = "SELECT * FROM blogposts";

    @Inject
    public BlogpostsRepository(final PgPool client, final AgroalDataSource agroalDataSource) {
        this.client = client;
        this.agroalDataSource = agroalDataSource;
    }

    public List<Blogpost> findAllJdbc() {
        var quotesList = new ArrayList<Blogpost>();
        try (Connection connection = agroalDataSource.getConnection();
            PreparedStatement preparedStatement = connection.prepareStatement(SELECT_ALL);
            ResultSet resultSet = preparedStatement.executeQuery();) {
            while (resultSet.next()) {
                quotesList.add(BlogpostMapper.toBlogpost(resultSet));
            }
        } catch (SQLException e) {
            e.printStackTrace();
        }
        return quotesList;
    }

    public Uni<List<Blogpost>> findAllReactiveUni() {
        return client.query(SELECT_ALL)
                .execute()
                .onItem().transform(BlogpostMapper::toBlogpost);
    }

    public Multi<Blogpost> findAllReactiveMulti() {
        return client.query(SELECT_ALL)
                .execute()
                .onItem().transformToMulti(set -> Multi.createFrom().iterable(set))
                .onItem().transform(BlogpostMapper::toBlogpost);
    }
}
Running the application
The easiest way to start the application is with the Quarkus cli
%>quarkus devYou should see output resembling the following:
By now, the application should be running and connected to a Postgresql database inside Docker.
Importing sample data
Now we’ll load some sample data so we can run a few tests and confirm that the application connects to the database.
Copy the sample data file into the main/resources/ directory.
Then we create an InitDb class whose job is to read the data from main/resources/sample-data.json and load it into the database.
The class recreates the db schema on every application start, so that each test runs against exactly the same data set.
@ApplicationScoped
public class InitDb {
    boolean schemaCreate;
    final PgPool client;

    @Inject
    public InitDb(@ConfigProperty(name = "blogposts.schema.create", defaultValue = "true") boolean schemaCreate,
                PgPool client) {
        this.schemaCreate = schemaCreate;
        this.client = client;
    }

    void config(@Observes StartupEvent ev) {
        if (schemaCreate) {
            run();
        }
    }

    private void run() {
        List<Tuple> batch = prepareData();
        client.query("DROP TABLE IF EXISTS blogposts").execute()
                .flatMap(r -> client.query("CREATE TABLE blogposts (id SERIAL PRIMARY KEY, author VARCHAR(256) NOT NULL, content TEXT NOT NULL , tags VARCHAR(256))").execute())
                .await().indefinitely();
        client.preparedQuery("INSERT INTO blogposts (author, content, tags) VALUES ($1, $2, $3)")
                .executeBatch(batch)
                .await().indefinitely();

    }

    private List<Tuple> prepareData() {
        try {
            InputStream in = getClass().getResourceAsStream("/sample-data.json");
            String result = new BufferedReader(new InputStreamReader(in))
                    .lines().collect(Collectors.joining("\n"));

            ObjectMapper mapper = new ObjectMapper();
            TypeReference<List<Blogpost>> documentMapType =
                    new TypeReference<>() {
                    };

            var document = mapper.readValue(result, documentMapType);

            return document.stream().map(i -> Tuple.of(i.author(), i.content(), i.tags())).toList();

        } catch (IOException e) {
            throw new RuntimeException(e);
        }
    }
}
Once restarted, the application should contain the sample data. You can check this by calling one of its urls: http://localhost:8080/sandbox/blocking/jdbc .
Testing
The tests were meant to check how the application uses CPU, memory and threads under load, and whether platform threads and virtual threads behave differently.
Test environment:
- CPU cores/threads - 10/10
- 64 GB RAM
- Postgresql in Docker
- Quarkus app in dev mode on Java OpenSDK Hot Spot 19
Siege served as the testing tool. It’s a straightforward command line utility whose clear summary is sufficient for what these tests need.
Every test fires 1000 requests, waiting 1s before each one.
Each response carries roughly 1.2MiB of JSON data.
Thread pool limit 10
Here, both the thread pool limit and the vertx worker pool size were set to 10 threads.
The minimum and maximum db connection counts were tuned as well, to keep data loss as low as possible.
quarkus.vertx.worker-pool-size=10
quarkus.thread-pool.max-threads=10
quarkus.datasource.jdbc.min-size = 60
quarkus.datasource.jdbc.max-size = 90
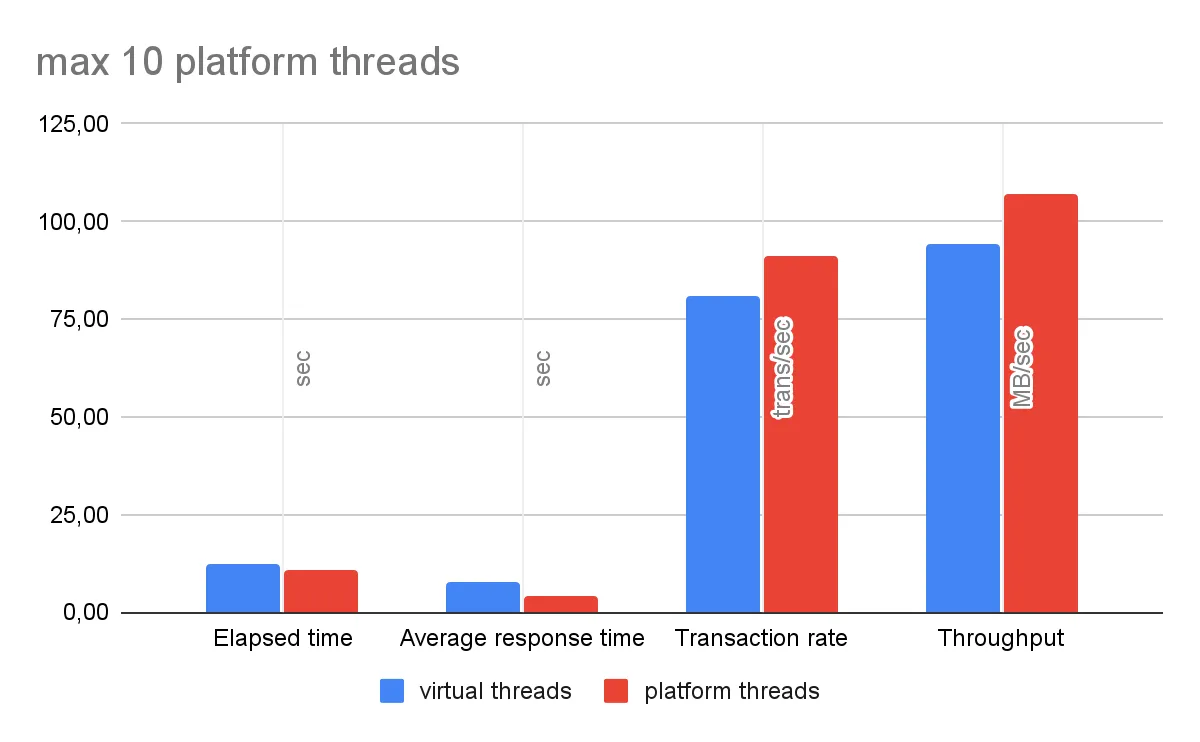
Siege test results
| virtual threads | platform threads | ||
|---|---|---|---|
| Elapsed time | 12,38 | 10,94 | sec |
| Average response time | 7,56 | 4,11 | sec |
| Transaction rate | 80,78 | 91,41 | trans/sec |
| Throughput | 94,47 | 106,91 | MB/sec |
Memory and CPU usage
Thread pool limit 100
Here, both the thread pool limit and the vertx worker pool size were set to 100 threads.
Again, the minimum and maximum db connection counts were tuned to keep data loss as low as possible.
quarkus.vertx.worker-pool-size=100
quarkus.thread-pool.max-threads=100
quarkus.datasource.jdbc.min-size = 60
quarkus.datasource.jdbc.max-size = 90
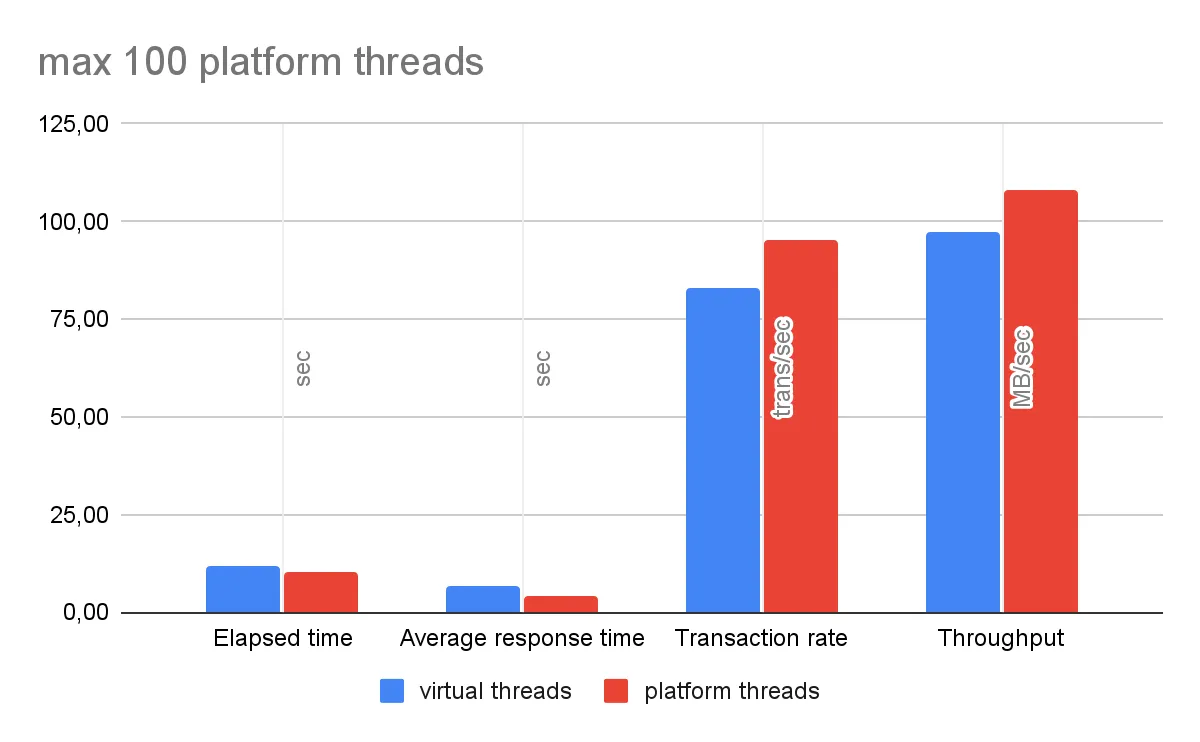
Siege test results
| virtual threads | platform threads | ||
|---|---|---|---|
| Elapsed time | 12,02 | 10,50 | sec |
| Average response time | 6,89 | 4,07 | sec |
| Transaction rate | 83,19 | 95,24 | trans/sec |
| Throughput | 97,30 | 108,27 | MB/sec |
Memory and CPU usage
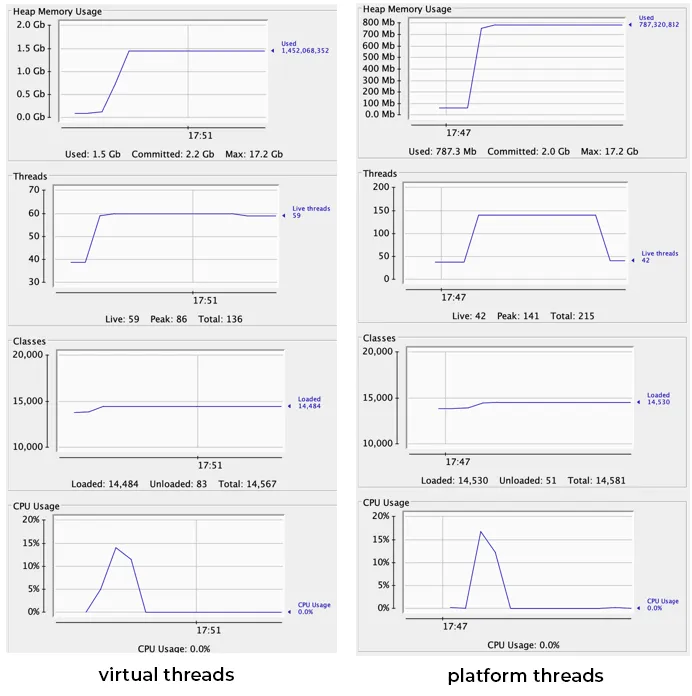
Thread pool limit 300
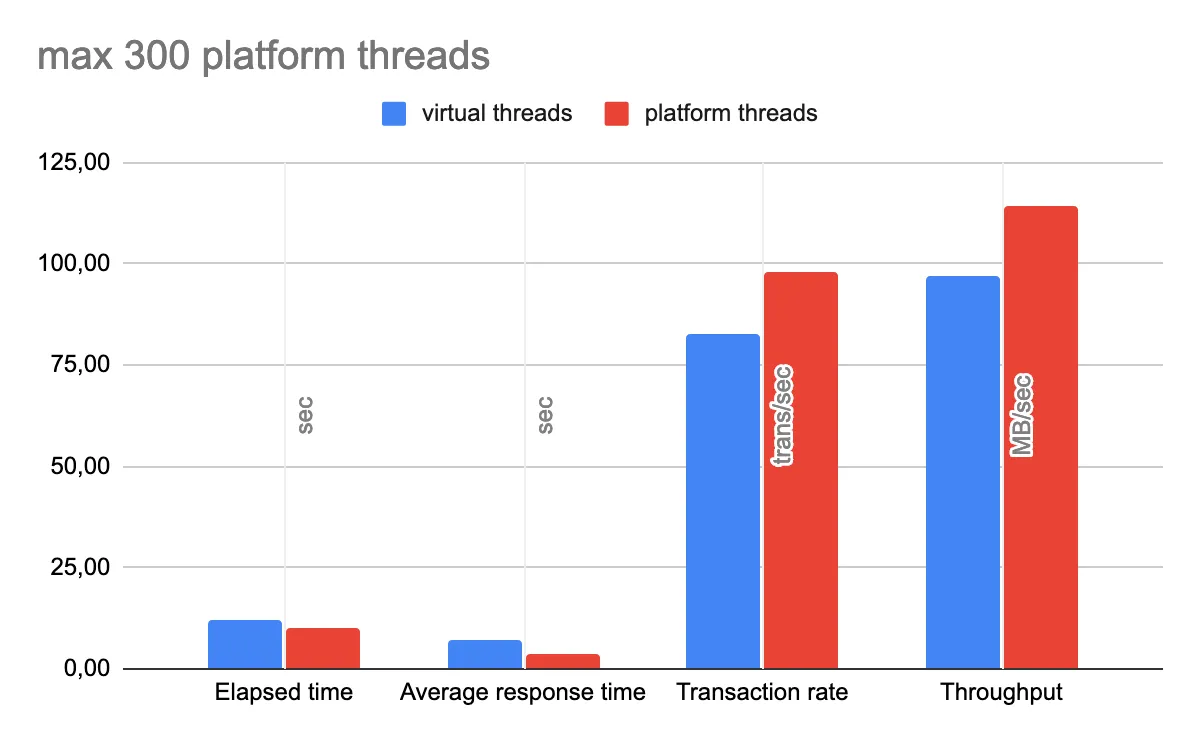
Here, both the thread pool limit and the vertx worker pool size were set to 300 threads.
Siege test results
| virtual threads | platform threads | ||
|---|---|---|---|
| Elapsed time | 12,07 | 10,23 | sec |
| Average response time | 6,99 | 3,92 | sec |
| Transaction rate | 82,85 | 97,75 | trans/sec |
| Throughput | 96,90 | 114,33 | MB/sec |
Memory and CPU usage
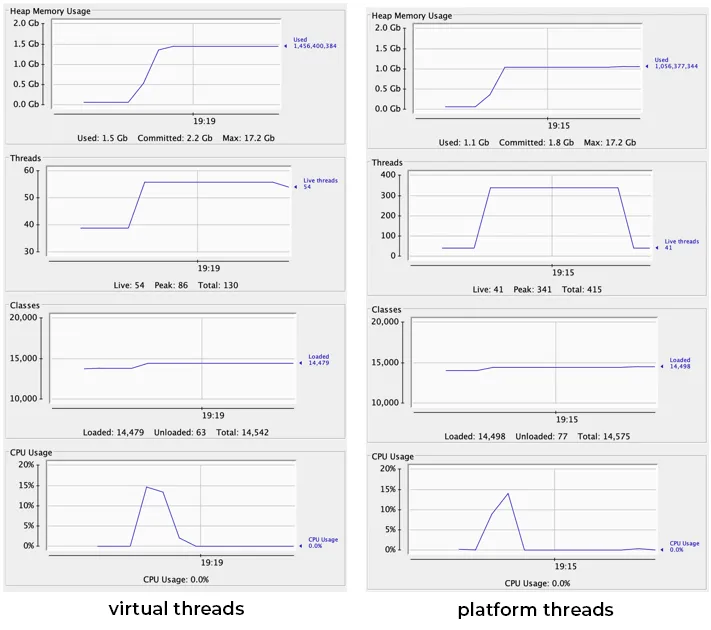
Thread pool limit 10 and long running task
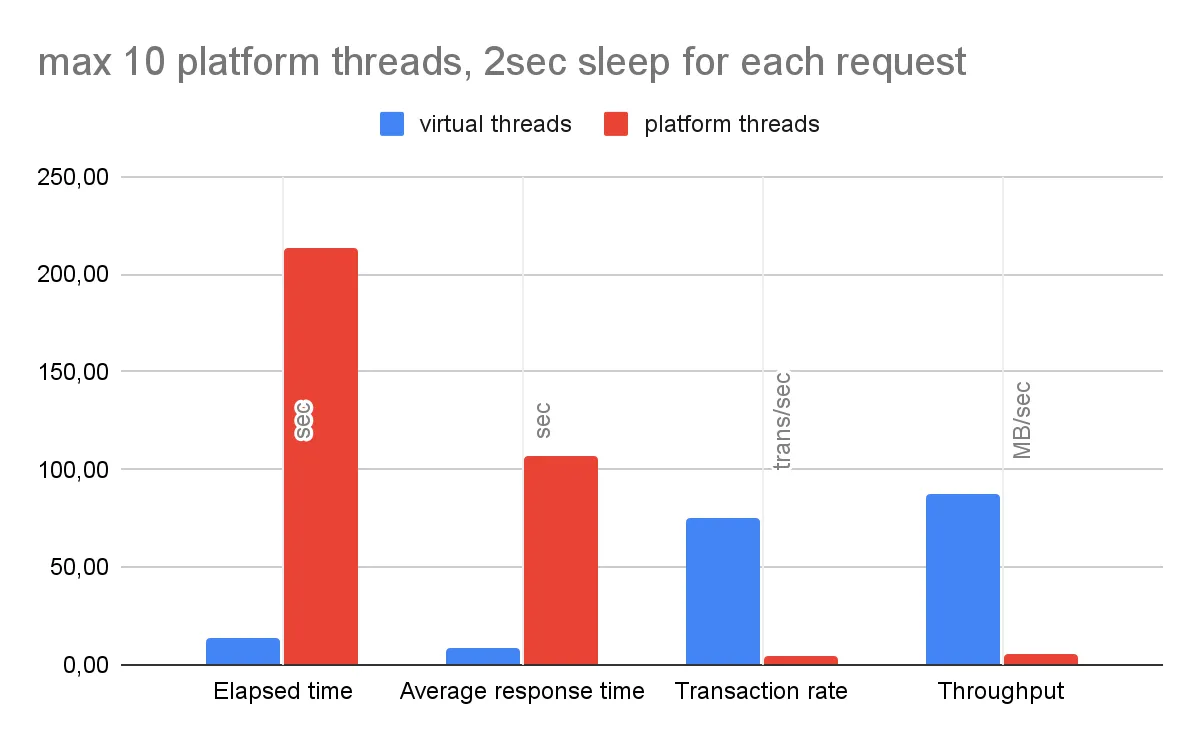
In this test, we watch how virtual threads deal with long-running tasks in comparison with platform threads. To simulate such a task, the original BlogpostsRepository has to be modified with Thread.sleep(). As a result, every request is held for 2 seconds before the value is returned.
public List<Blogpost> findAllJdbc() {
        var quotesList = new ArrayList<Blogpost>();
        try (Connection connection = agroalDataSource.getConnection();
            PreparedStatement preparedStatement = connection.prepareStatement(SELECT_ALL);
            ResultSet resultSet = preparedStatement.executeQuery();) {
            while (resultSet.next()) {
                quotesList.add(BlogpostMapper.toBlogpost(resultSet));
            }
        } catch (SQLException e) {
            e.printStackTrace();
        }
        try {
            Thread.sleep(2000);
        } catch (InterruptedException e) {
            throw new RuntimeException(e);
        }
        return quotesList;
    }
Siege test results
| virtual threads | platform threads | ||
|---|---|---|---|
| Elapsed time | 13,34 | 213,81 | sec |
| Average response time | 8,15 | 106,56 | sec |
| Transaction rate | 74,96 | 4,68 | trans/sec |
| Throughput | 87,68 | 5,47 | MB/sec |
Memory and CPU usage
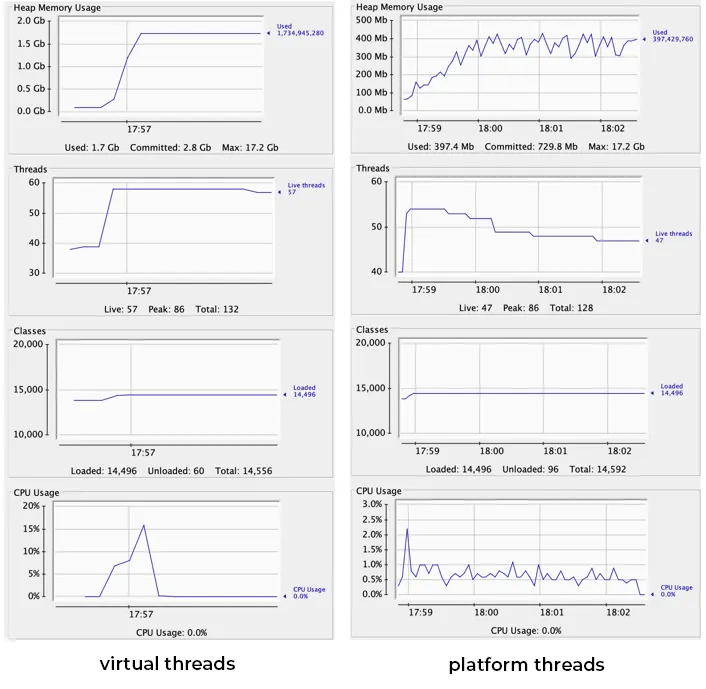
Summary
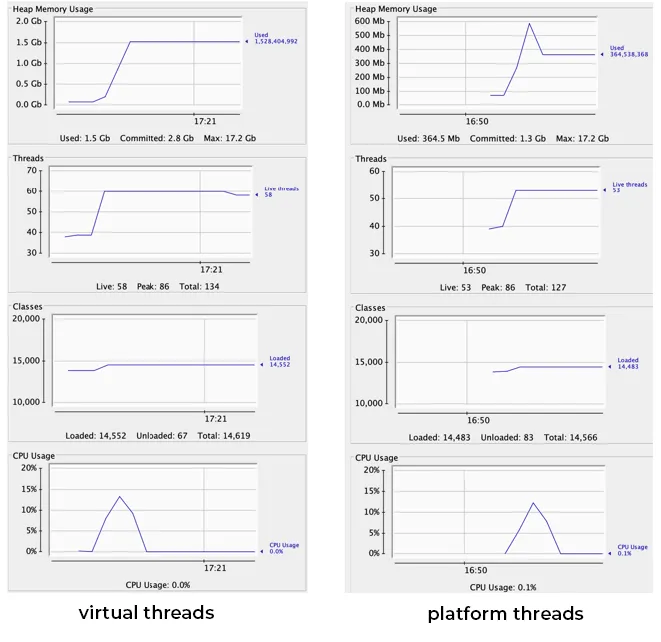
A first look at the results suggests that virtual threads perform roughly the same as platform threads. The first two tests, however, reveal that platform threads perform better as the thread pool grows, while virtual threads stay at more or less the same level. The test with a pool size of 300 tips the scales even further toward platform threads. So why bother with virtual threads at all, if they are slower and on top of that use twice as much heap memory as platform threads?
The final test reveals what virtual threads are really capable of. Looking more closely at the results, we see that with a pool of 10, platform threads struggle to serve all the long-running requests – they needed over 200 seconds to finish. Virtual threads, by contrast, prove extremely fast and are done after 13 seconds.
This is thanks to the non-blocking character of virtual threads. They don’t pin to a platform thread unless it’s necessary, so the platform thread is free to serve other requests, which results in high throughput.
That looks very encouraging, but we have to remember that Loom is still in its infancy, and we haven’t discovered all of its pitfalls yet.
In my view, programmers won’t be using Loom directly in their everyday work. What matters more is when the large ecosystem of libraries and frameworks adds Loom support.
On the other hand, it might also give rise to new projects designed around Loom from the start, and we may see a change in which libraries get used – at least among microservices, where high throughput is essential.